

Key Insights
- Traders and investors are now wondering whether or not Solana is gearing up for a repeat of one of its biggest historical rallies.
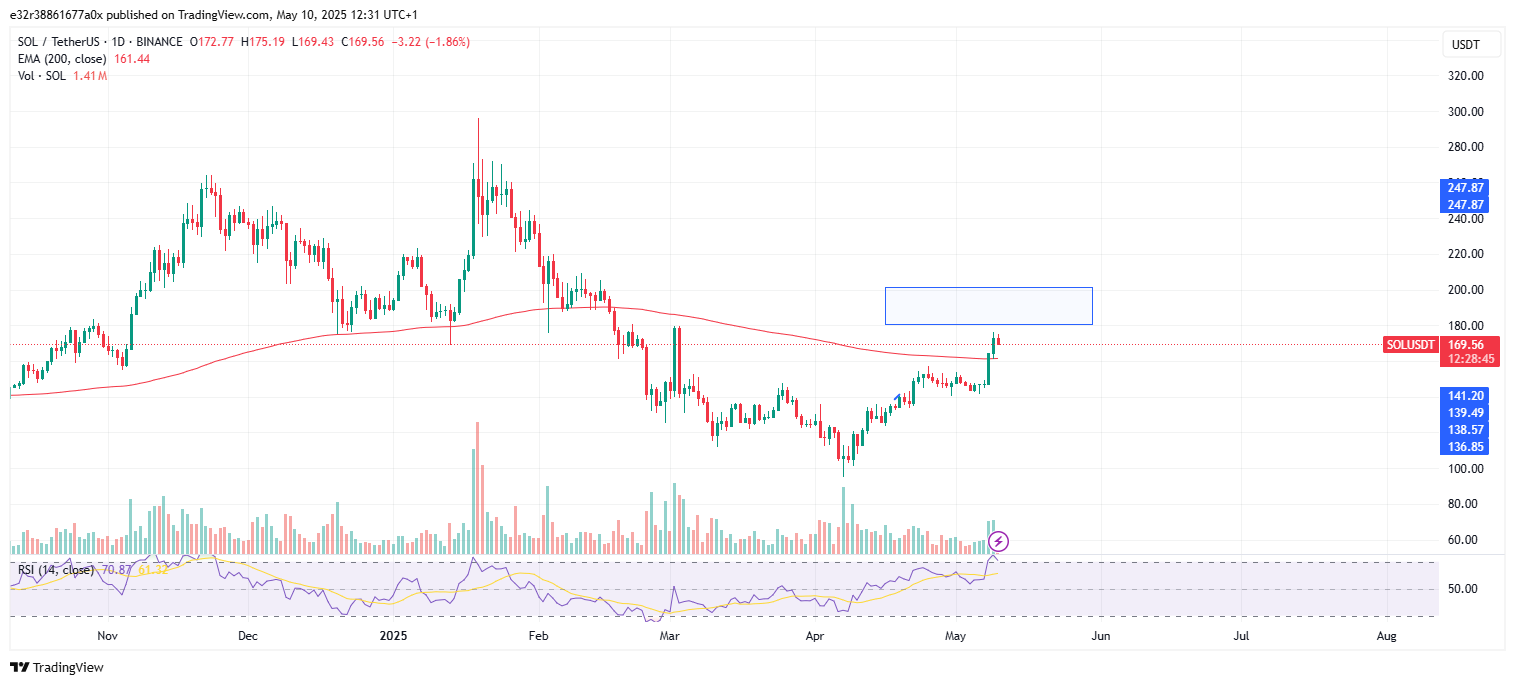
- Solana has jumped by around 18% over the last week and is now trading near a major resistance zone around its 50-week EMA.
- The RSI has also bounced back above 50, which shows that the bulls are back in business for the long term.
- If Solana can break above $180 and flip it into support, it could create a parabolic rally that starts in Q3 and lasts until the rest of the year
- The 50-week EMA is proving to be a powerful gauge of trend direction, and Solana could be on the verge of a push towards $250 or even $350 by late 2025.
Solana is once again making waves in the crypto space, on the back of the generally bullish momentum.
So far, traders and investors are now wondering whether or not Solana is gearing up for a repeat of one of its biggest historical rallies.
Technical indicators are now aligning, and liquidity flows are increasing. DeFi conditions are even on the rise, and the conditions look like a breakout is indeed on the horizon.
However, there are still a few challenges to keep an eye out for, including the resistance around the $180 level and the selling pressure from profit takers in the market.
Here are a few things to keep in mind.
Solana’s Technical Setup Looks Strong
Solana has jumped by around 18% over the last week and is now trading near a major resistance zone around its 50-week Exponential Moving Average, or EMA.
Historically, this price level has been a major launchpad for major rallies, and all eyes are on Solana’s price action as a result.
For instance, back in October of 2023, the cryptocurrency managed to break above both its 50-week and 100-week EMAs.
What followed was a consolidation phase, after which the token surged 515% by March last year.
The ongoing technical setup appears to be doing the same thing, and Solana is attempting to hold above its 50-week EMA.
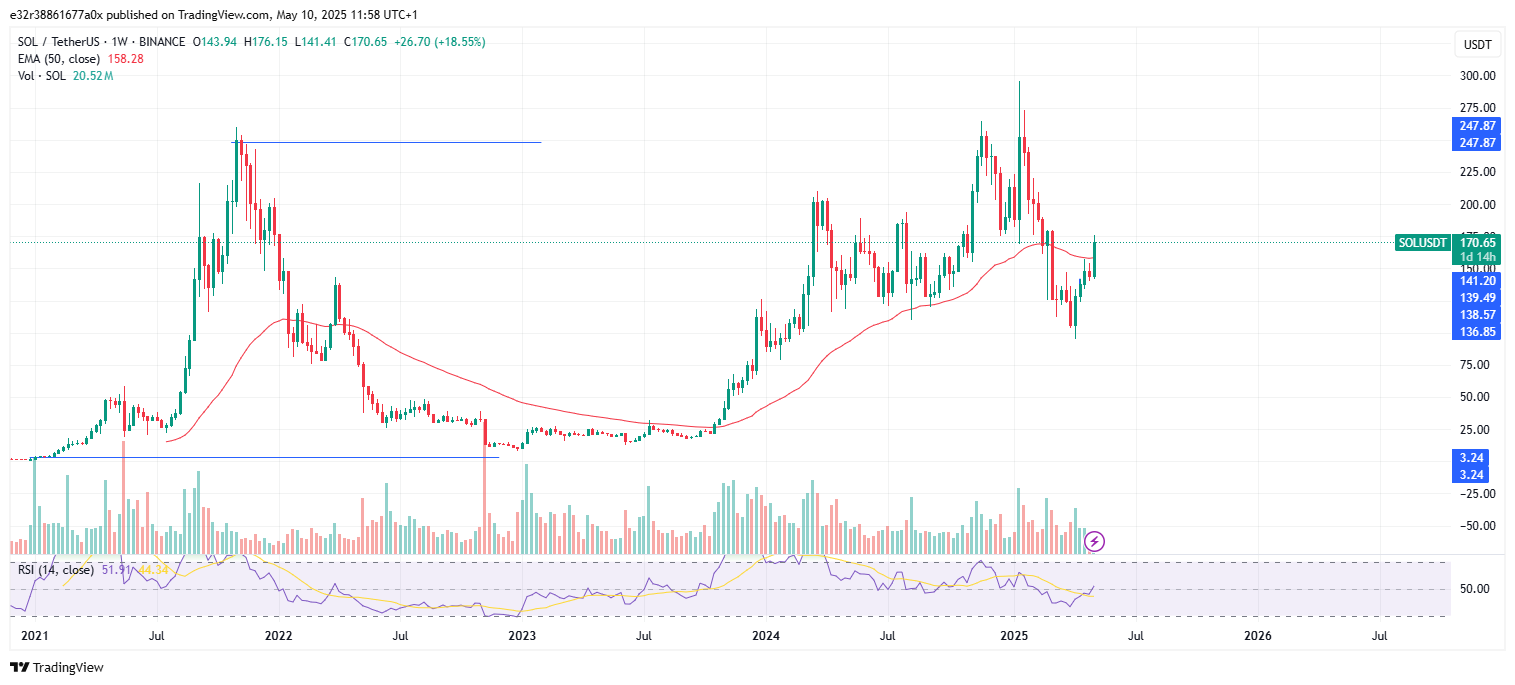
The RSI has also bounced back above 50, which shows that the bulls are back in business for the long term.
If SOL does hold this support and manages to flip its resistance levels into support, the price could be close to hitting the $250–$350 range by September 2025.
Daily Charts Show Bullish Signals
The daily chart also shows that Solana recently closed above the 200-day EMA, which is another major sign of growth.
This means that traders will now be watching the $180 level closely.
If Solana can break above this price level and flip it into support, it could create a parabolic rally that starts in Q3 and lasts until the rest of the year
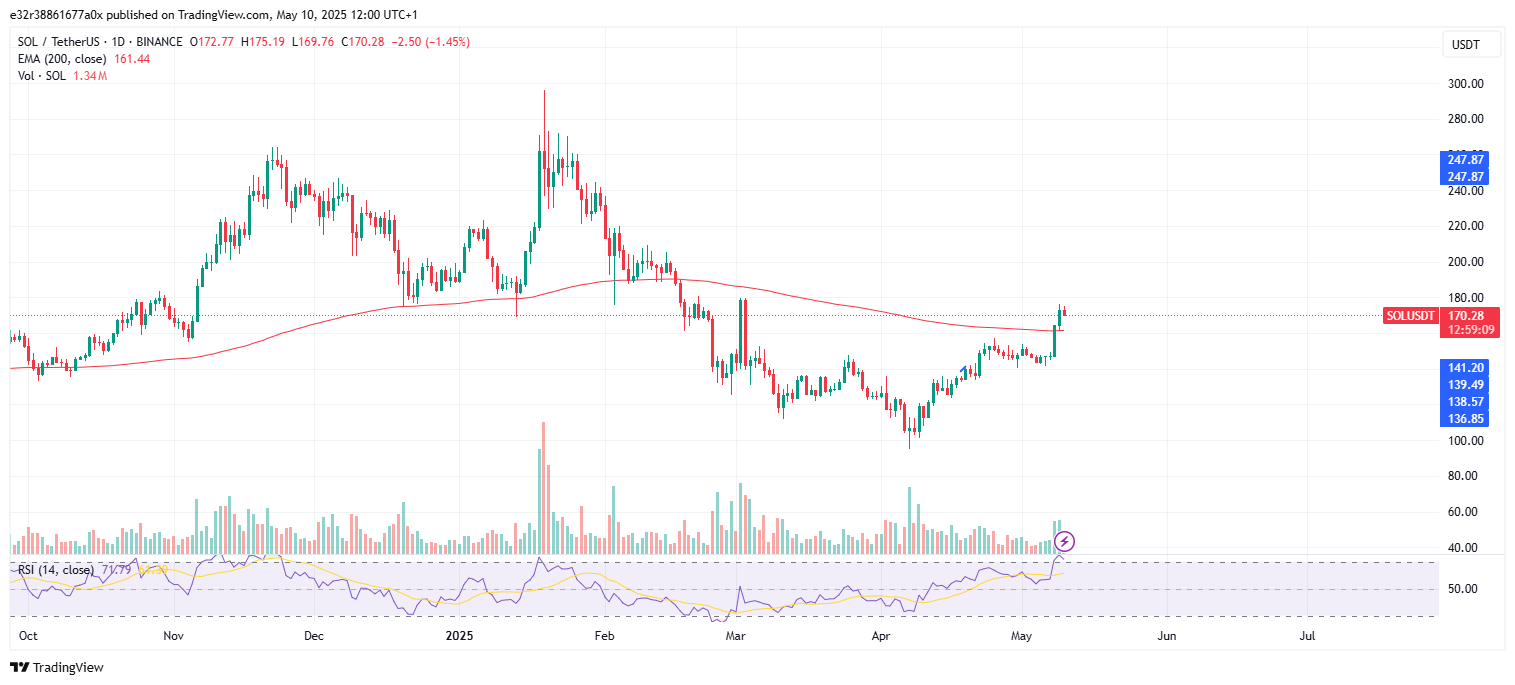
So far, it would not be far-fetched to assume that Solana might indeed turn bullish with a break above the $173.85 resistance.
Price targets from this level would be around $184.27, and a stop-loss might just sit below $167.00.
This stands as a massive high-risk, high-reward setup, especially if the ongoing momentum holds.
Liquidity Inflows Point to Network Confidence
More than what the charts show, Solana is seeing strong liquidity inflows from other blockchains.
The last 30 days have seen more than $165 million bridged to the network. Ethereum led the transfers with $80.4 million, followed by Arbitrum ($44 million), Base ($20 million), BNB Chain ($8 million), and Sonic ($6 million), according to Debridge data.
These inflows show that the trust in the Solana ecosystem is on the rise, especially in terms of performance, speed, and cost-efficiency compared to Ethereum.
More and more liquidity is flowing into the network, and Solana’s capacity to support trading, lending, and other DeFi activities is on the rise.
DeFi Dominance Strengthens the Bull Case
According to DeFiLlama, Solana recently recorded the highest DEX volumes among all chains, with $4 billion in just 24 hours.
This gave the network a commanding 28.99% share of the DEX market, which is more than any other blockchain.
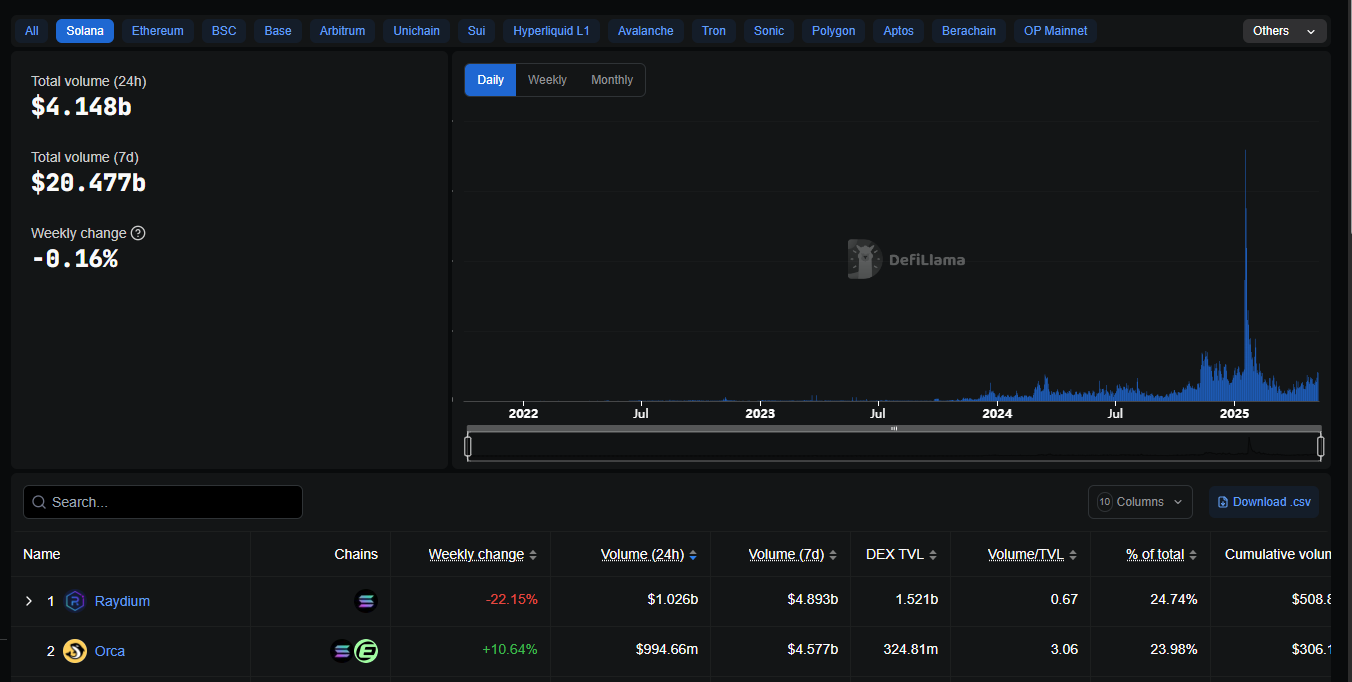
This kind of DeFi dominance shows that investors and developers are recognizing the network’s scalability and growing user base.
Its lower transaction fees and high throughput make Solana a preferred destination for traders and developers alike.
The $200 Resistance
Despite the optimism, Solana still has tough battles ahead of it, especially around the $180–$200 range.
This resistance is not only psychological; it has also been difficult for the cryptocurrency to break in the past.
Solana’s price is now close to being overbought according to the RSI on the daily chart, and it could mean that short-term traders are taking profits.
In addition, the realized profit/loss ratio has surged to 15.0, which is well above the usual threshold of 10.0.
As a result, investors taking profits could put downward pressure on price and introduce volatility to the market.
If the $180 price level holds fast, Solana might experience a small pullback towards the $161 price level, which once acted as support for the cryptocurrency.
A failure to maintain this support as well could lead to an even steeper crash.
Investor Sentiment and Short-Term Risks
Solana has made a 61% price increase over the last month. This fact alone is encouraging but also creates some conditions for a possible retracement.
Many investors are now in profit, and there is an increased risk of sell-offs.
When profit-taking starts to accelerate, it tends to cause short-term corrections, even in strong uptrends.
While the long-term prospects for Solana are still positive (especially if technical levels are maintained), traders should still be ready for volatility.
Solana staying above the 50-week EMA will be very important for its future. At the same time, a drop below could invalidate the bullish setup and delay Solana’s next leg upward.
Is Solana Ready for Another 500% Rally?
Solana is clearly strong at its current position, with its technical indicators all showing bullish signals.
Technical indicators are flashing bullish, and DeFi metrics show it’s outperforming many competitors.
Overall, the 50-week EMA is proving to be a powerful gauge of trend direction, and holding above it could lead to explosive growth.
Solana could be on the verge of a push towards $250 or even $350 by late 2025.